Old References, New Doubts: Why Citation Recency Signals Research Currency
There is a quiet judgment that happens the moment a peer reviewer flips to the back of your manuscript. Before they have weighed your methodology or interrogated your statistics, they are already forming an impression. The reference list, that long column of names and years, is functioning as a kind of résumé for your research literacy. And one of the most telling signals in it is the one that is easiest to overlook: the distribution of years.
This is what CiteOrbit's year-distribution insight is designed to surface. Not just how many references you have, but when those references were published, and what that pattern reveals about the intellectual health of your work.
The year spread is a story, not just a statistic
Think of your reference list as a timeline. Every entry marks a moment when human knowledge shifted in some way relevant to your argument. A reference from 2003 might be the foundational paper that defined the framework you are building on. A reference from last year might signal that you caught a pivotal replication or a contradictory meta-analysis before you committed to your hypothesis.
When a reviewer scans that timeline, they are asking an implicit question: does this researcher know where the field is now, and do they also know where it came from?
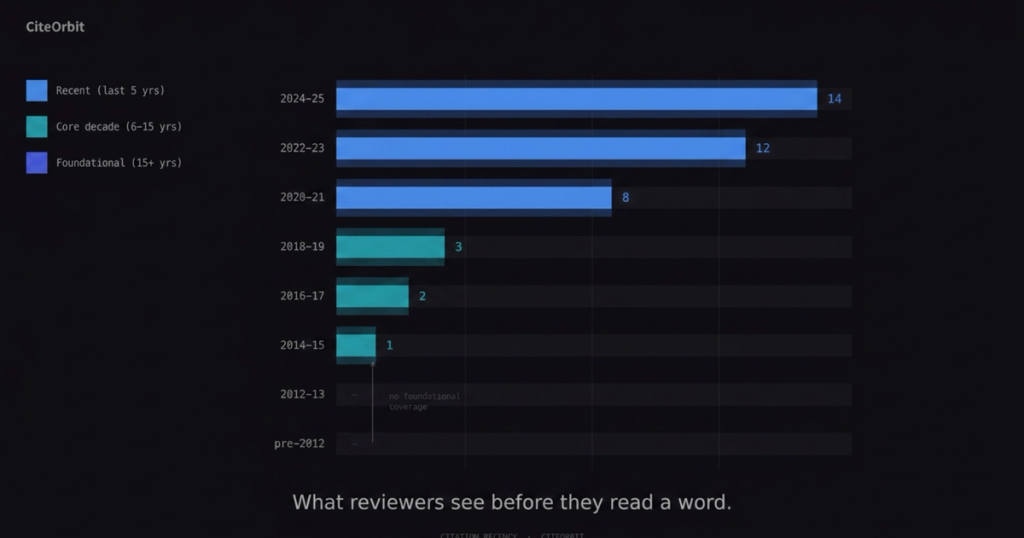
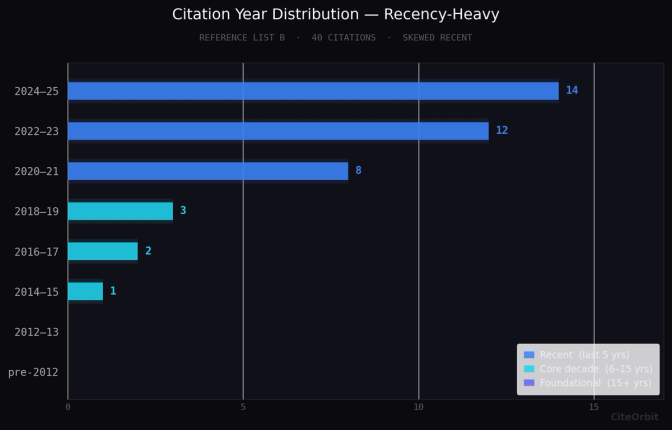
A reference list that clusters almost entirely in the past five years looks like a literature review that was conducted in a hurry, or by someone who ran a quick database search and stopped at the first page of results. It suggests the author may not know the foundational papers that give the field its conceptual vocabulary. On the other hand, a list where everything predates 2015 signals something equally worrying: that the author has not kept up, that they may be unaware of recent trials, reanalyzes, or paradigm shifts that would directly complicate their claims.
Neither extreme is neutral. Both send a message about research currency and depth.
What "recency balance" actually means in practice
When CiteOrbit analyses your year distribution, it is not simply flagging whether your newest reference is recent enough. It is looking at the shape of the whole curve, and comparing it against what a well-grounded literature review in your field tends to look like.
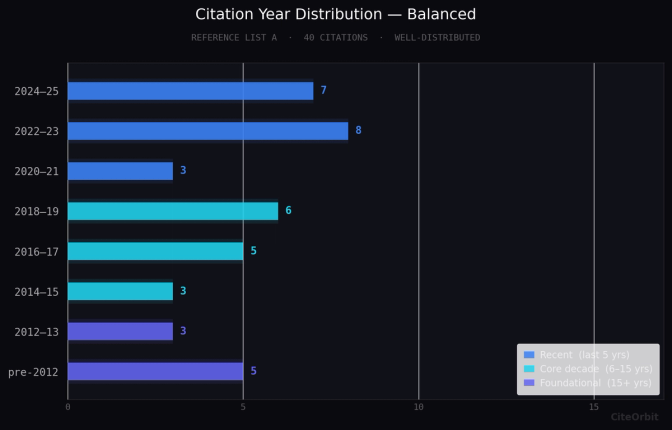
A rough benchmark that holds across most empirical disciplines: roughly 40 to 50 percent of citations should come from the last five years, 30 to 35 percent from the preceding decade (the "core" period when the field's current consensus was built), and 15 to 20 percent from earlier foundational work. These are not hard rules, and they shift by discipline. A paper in theoretical mathematics will legitimately lean on work from the 1960s in ways that a clinical neuroscience paper should not. But the underlying logic is consistent: your reference list should show depth across time, not a spike in one era and a gap everywhere else.
The charts below illustrate two hypothetical reference lists, each containing 40 citations. List A distributes references across the timeline in a way that suggests a researcher who has done the full work: staying current while respecting the intellectual history of the field. List B, despite containing the same number of references, tells a different story. The heavy weighting toward the most recent two or three years, with almost nothing from the foundational period, would raise questions for most reviewers.
Why reviewers are specifically trained to notice this
This is not an informal heuristic. Publication guidelines from journals like PLOS ONE, The BMJ, and journals in the Nature family all include guidance on reference quality, and recency balance is part of what editors evaluate during desk review [1]-[3]. The American Psychological Association's Publication Manual, seventh edition, explicitly addresses the expectation that authors demonstrate awareness of current research alongside seminal contributions [4].
In grant review panels, the picture is even more pronounced. Reviewers for bodies like the NIH or the European Research Council are explicitly evaluating "significance," which requires the applicant to situate their work within the current state of the field [5], [6]. A literature foundation that stops several years short of the submission date is a visible warning sign that the applicant may have missed recent competing work, or may be proposing something already addressed elsewhere.
The specific failure modes CiteOrbit can catch
Beyond the broad curve, there are subtler year-distribution problems that are easy to miss when you are deep in a submission:
- The self-citation cluster: If a large proportion of your recent references are your own prior publications, the year distribution will look artificially current even though it is not representing genuine field coverage. CiteOrbit's breakdown allows you to spot this kind of inflation before a reviewer does.
- The review-paper shortcut: A reference list dominated by review articles from a single recent year can look balanced on a year chart but actually represents thin engagement with primary literature. The year distribution is one lens; the source-type breakdown is another.
- The database cutoff shadow: Many researchers set their database search with a start year for pragmatic reasons ("too much literature to cover before 2010") and forget that this creates an artificial gap in the record. The year chart will show the cliff edge clearly.
- The field-specific lag: In some disciplines, a two-year gap between data collection and publication is normal. In others, preprints are the currency and anything older than eighteen months is already stale. CiteOrbit benchmarks against field norms rather than applying a single universal standard, which is what makes the recency-balance reading useful rather than just descriptive.
A question worth asking your own reference list
Here is a useful exercise before your next submission. Pull your reference list into a simple spreadsheet and count citations by year, grouping them into five-year bands. Now look at the shape. Does it tell the story of a researcher who is genuinely embedded in the living conversation of your field? Or does it show the shape of a literature review that was assembled quickly, or never updated after the initial draft?
If you find a gap in the middle of your timeline, that is often the most interesting signal. It can mean that a productive decade of scholarship in your area simply did not make it into your review, which is worth investigating before a reviewer does the investigating for you.
CiteOrbit surfaces this kind of pattern automatically as part of its citation analysis, specifically because it is the kind of thing that is genuinely hard to see when you are the one who wrote the reference list. You know what you cited and why. What you cannot easily see is the shape of the distribution, and what that shape communicates to someone reading it fresh.
Recency balance as a proxy for research maturity
There is a deeper reason this metric matters, beyond the tactical concern of satisfying reviewers. A researcher who consistently maintains a balanced year distribution in their citations is, almost by definition, doing something intellectually valuable: they are reading across time, not just surfing the surface of the newest publications. They are asking which recent developments change the meaning of earlier findings. They are connecting the present moment in their field to the assumptions and frameworks that shaped it.
That habit of mind shows up in the reference list. And reviewers, who are themselves embedded researchers with a feel for what thorough scholarship looks like, tend to recognize it even when they cannot articulate exactly what they are noticing.
The year distribution chart is, in that sense, not just a quality check. It is a portrait of how you engage with your field. It is worth taking seriously.
What does your current reference list look like when you break it down by year? Is the distribution what you would expect, or does it reveal a gap you had not noticed?
References
[1] PLOS ONE Editorial and Publishing Policies [Internet]. San Francisco: Public Library of Science; 2024 [cited 2026 May 30]. Available from: https://journals.plos.org/plosone/s/editorial-and-publishing-policies
[2] The BMJ. Resources for authors [Internet]. London: BMJ Publishing Group; 2024 [cited 2026 May 30]. Available from: https://www.bmj.com/about-bmj/resources-authors
[3] Nature Portfolio. For authors and referees [Internet]. London: Springer Nature; 2024 [cited 2026 May 30]. Available from: https://www.nature.com/nature/for-authors
[4] American Psychological Association. Publication manual of the American Psychological Association. 7th ed. Washington (DC): APA; 2020.
[5] National Institutes of Health. Peer review process [Internet]. Bethesda (MD): NIH; 2024 [cited 2026 May 30]. Available from: https://grants.nih.gov/grants/peer-review.htm
[6] European Research Council. ERC peer review evaluation criteria [Internet]. Brussels: ERC; 2024 [cited 2026 May 30]. Available from: https://erc.europa.eu/apply-grant/peer-review